data-science-ipython-notebooks
Index
- deep-learning
- scikit-learn
- statistical-inference-scipy
- pandas
- matplotlib
- numpy
- python-data
- kaggle-and-business-analyses
- spark
- mapreduce-python
- amazon web services
- command lines
- misc
- notebook-installation
- credits
- contributing
- contact-info
- license

deep-learning
IPython Notebook(s) demonstrating deep learning functionality.

tensor-flow-tutorials
Additional TensorFlow tutorials:
- pkmital/tensorflow_tutorials
- nlintz/TensorFlow-Tutorials
- alrojo/tensorflow-tutorial
- BinRoot/TensorFlow-Book
| Notebook | Description |
|---|---|
| tsf-basics | Learn basic operations in TensorFlow, a library for various kinds of perceptual and language understanding tasks from Google. |
| tsf-linear | Implement linear regression in TensorFlow. |
| tsf-logistic | Implement logistic regression in TensorFlow. |
| tsf-nn | Implement nearest neighboars in TensorFlow. |
| tsf-alex | Implement AlexNet in TensorFlow. |
| tsf-cnn | Implement convolutional neural networks in TensorFlow. |
| tsf-mlp | Implement multilayer perceptrons in TensorFlow. |
| tsf-rnn | Implement recurrent neural networks in TensorFlow. |
| tsf-gpu | Learn about basic multi-GPU computation in TensorFlow. |
| tsf-gviz | Learn about graph visualization in TensorFlow. |
| tsf-lviz | Learn about loss visualization in TensorFlow. |
tensor-flow-exercises
| Notebook | Description |
|---|---|
| tsf-not-mnist | Learn simple data curation by creating a pickle with formatted datasets for training, development and testing in TensorFlow. |
| tsf-fully-connected | Progressively train deeper and more accurate models using logistic regression and neural networks in TensorFlow. |
| tsf-regularization | Explore regularization techniques by training fully connected networks to classify notMNIST characters in TensorFlow. |
| tsf-convolutions | Create convolutional neural networks in TensorFlow. |
| tsf-word2vec | Train a skip-gram model over Text8 data in TensorFlow. |
| tsf-lstm | Train a LSTM character model over Text8 data in TensorFlow. |
theano-tutorials
| Notebook | Description |
|---|---|
| theano-intro | Intro to Theano, which allows you to define, optimize, and evaluate mathematical expressions involving multi-dimensional arrays efficiently. It can use GPUs and perform efficient symbolic differentiation. |
| theano-scan | Learn scans, a mechanism to perform loops in a Theano graph. |
| theano-logistic | Implement logistic regression in Theano. |
| theano-rnn | Implement recurrent neural networks in Theano. |
| theano-mlp | Implement multilayer perceptrons in Theano. |

keras-tutorials
| Notebook | Description |
|---|---|
| keras | Keras is an open source neural network library written in Python. It is capable of running on top of either Tensorflow or Theano. |
| setup | Learn about the tutorial goals and how to set up your Keras environment. |
| intro-deep-learning-ann | Get an intro to deep learning with Keras and Artificial Neural Networks (ANN). |
| theano | Learn about Theano by working with weights matrices and gradients. |
| keras-otto | Learn about Keras by looking at the Kaggle Otto challenge. |
| ann-mnist | Review a simple implementation of ANN for MNIST using Keras. |
| conv-nets | Learn about Convolutional Neural Networks (CNNs) with Keras. |
| conv-net-1 | Recognize handwritten digits from MNIST using Keras – Part 1. |
| conv-net-2 | Recognize handwritten digits from MNIST using Keras – Part 2. |
| keras-models | Use pre-trained models such as VGG16, VGG19, ResNet50, and Inception v3 with Keras. |
| auto-encoders | Learn about Autoencoders with Keras. |
| rnn-lstm | Learn about Recurrent Neural Networks (RNNs) with Keras. |
| lstm-sentence-gen | Learn about RNNs using Long Short Term Memory (LSTM) networks with Keras. |
deep-learning-misc
| Notebook | Description |
|---|---|
| deep-dream | Caffe-based computer vision program which uses a convolutional neural network to find and enhance patterns in images. |

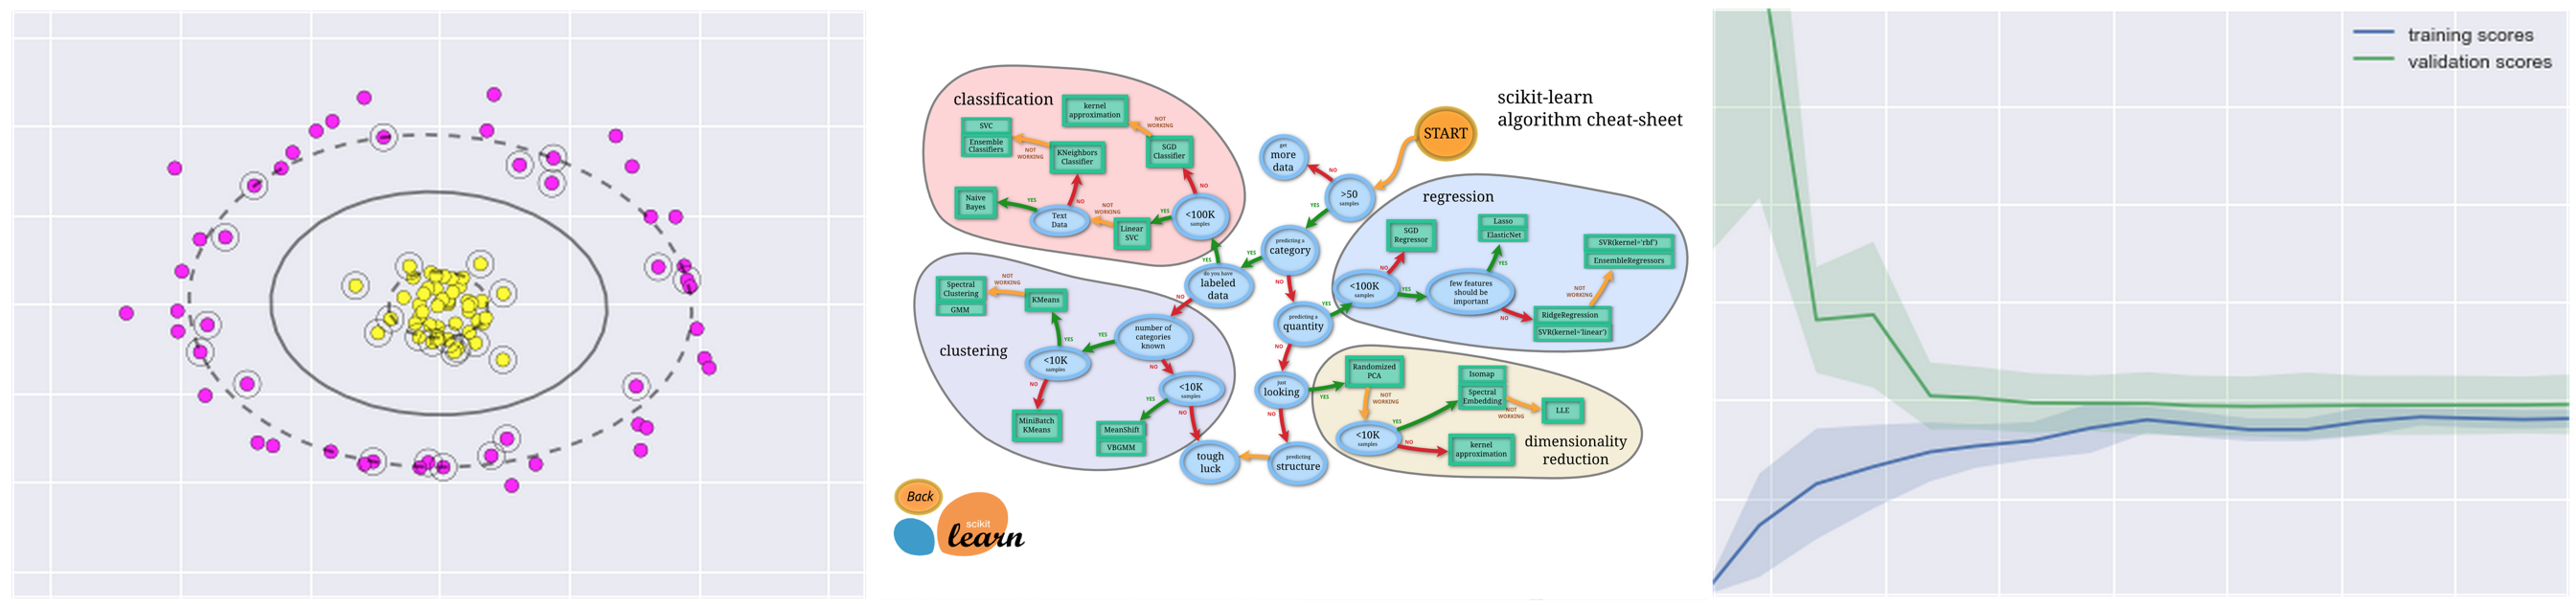
scikit-learn
IPython Notebook(s) demonstrating scikit-learn functionality.
| Notebook | Description |
|---|---|
| intro | Intro notebook to scikit-learn. Scikit-learn adds Python support for large, multi-dimensional arrays and matrices, along with a large library of high-level mathematical functions to operate on these arrays. |
| knn | Implement k-nearest neighbors in scikit-learn. |
| linear-reg | Implement linear regression in scikit-learn. |
| svm | Implement support vector machine classifiers with and without kernels in scikit-learn. |
| random-forest | Implement random forest classifiers and regressors in scikit-learn. |
| k-means | Implement k-means clustering in scikit-learn. |
| pca | Implement principal component analysis in scikit-learn. |
| gmm | Implement Gaussian mixture models in scikit-learn. |
| validation | Implement validation and model selection in scikit-learn. |

statistical-inference-scipy
IPython Notebook(s) demonstrating statistical inference with SciPy functionality.
| Notebook | Description |
|---|---|
| scipy | SciPy is a collection of mathematical algorithms and convenience functions built on the Numpy extension of Python. It adds significant power to the interactive Python session by providing the user with high-level commands and classes for manipulating and visualizing data. |
| effect-size | Explore statistics that quantify effect size by analyzing the difference in height between men and women. Uses data from the Behavioral Risk Factor Surveillance System (BRFSS) to estimate the mean and standard deviation of height for adult women and men in the United States. |
| sampling | Explore random sampling by analyzing the average weight of men and women in the United States using BRFSS data. |
| hypothesis | Explore hypothesis testing by analyzing the difference of first-born babies compared with others. |
pandas
IPython Notebook(s) demonstrating pandas functionality.
| Notebook | Description |
|---|---|
| pandas | Software library written for data manipulation and analysis in Python. Offers data structures and operations for manipulating numerical tables and time series. |
| github-data-wrangling | Learn how to load, clean, merge, and feature engineer by analyzing GitHub data from the Viz repo. |
| Introduction-to-Pandas | Introduction to Pandas. |
| Introducing-Pandas-Objects | Learn about Pandas objects. |
| Data Indexing and Selection | Learn about data indexing and selection in Pandas. |
| Operations-in-Pandas | Learn about operating on data in Pandas. |
| Missing-Values | Learn about handling missing data in Pandas. |
| Hierarchical-Indexing | Learn about hierarchical indexing in Pandas. |
| Concat-And-Append | Learn about combining datasets: concat and append in Pandas. |
| Merge-and-Join | Learn about combining datasets: merge and join in Pandas. |
| Aggregation-and-Grouping | Learn about aggregation and grouping in Pandas. |
| Pivot-Tables | Learn about pivot tables in Pandas. |
| Working-With-Strings | Learn about vectorized string operations in Pandas. |
| Working-with-Time-Series | Learn about working with time series in pandas. |
| Performance-Eval-and-Query | Learn about high-performance Pandas: eval() and query() in Pandas. |

matplotlib
IPython Notebook(s) demonstrating matplotlib functionality.
| Notebook | Description |
|---|---|
| matplotlib | Python 2D plotting library which produces publication quality figures in a variety of hardcopy formats and interactive environments across platforms. |
| matplotlib-applied | Apply matplotlib visualizations to Kaggle competitions for exploratory data analysis. Learn how to create bar plots, histograms, subplot2grid, normalized plots, scatter plots, subplots, and kernel density estimation plots. |
| Introduction-To-Matplotlib | Introduction to Matplotlib. |
| Simple-Line-Plots | Learn about simple line plots in Matplotlib. |
| Simple-Scatter-Plots | Learn about simple scatter plots in Matplotlib. |
| Errorbars.ipynb | Learn about visualizing errors in Matplotlib. |
| Density-and-Contour-Plots | Learn about density and contour plots in Matplotlib. |
| Histograms-and-Binnings | Learn about histograms, binnings, and density in Matplotlib. |
| Customizing-Legends | Learn about customizing plot legends in Matplotlib. |
| Customizing-Colorbars | Learn about customizing colorbars in Matplotlib. |
| Multiple-Subplots | Learn about multiple subplots in Matplotlib. |
| Text-and-Annotation | Learn about text and annotation in Matplotlib. |
| Customizing-Ticks | Learn about customizing ticks in Matplotlib. |
| Settings-and-Stylesheets | Learn about customizing Matplotlib: configurations and stylesheets. |
| Three-Dimensional-Plotting | Learn about three-dimensional plotting in Matplotlib. |
| Geographic-Data-With-Basemap | Learn about geographic data with basemap in Matplotlib. |
| Visualization-With-Seaborn | Learn about visualization with Seaborn. |
numpy
IPython Notebook(s) demonstrating NumPy functionality.
| Notebook | Description |
|---|---|
| numpy | Adds Python support for large, multi-dimensional arrays and matrices, along with a large library of high-level mathematical functions to operate on these arrays. |
| Introduction-to-NumPy | Introduction to NumPy. |
| Understanding-Data-Types | Learn about data types in Python. |
| The-Basics-Of-NumPy-Arrays | Learn about the basics of NumPy arrays. |
| Computation-on-arrays-ufuncs | Learn about computations on NumPy arrays: universal functions. |
| Computation-on-arrays-aggregates | Learn about aggregations: min, max, and everything in between in NumPy. |
| Computation-on-arrays-broadcasting | Learn about computation on arrays: broadcasting in NumPy. |
| Boolean-Arrays-and-Masks | Learn about comparisons, masks, and boolean logic in NumPy. |
| Fancy-Indexing | Learn about fancy indexing in NumPy. |
| Sorting | Learn about sorting arrays in NumPy. |
| Structured-Data-NumPy | Learn about structured data: NumPy’s structured arrays. |
python-data
IPython Notebook(s) demonstrating Python functionality geared towards data analysis.
| Notebook | Description |
|---|---|
| data structures | Learn Python basics with tuples, lists, dicts, sets. |
| data structure utilities | Learn Python operations such as slice, range, xrange, bisect, sort, sorted, reversed, enumerate, zip, list comprehensions. |
| functions | Learn about more advanced Python features: Functions as objects, lambda functions, closures, *args, **kwargs currying, generators, generator expressions, itertools. |
| datetime | Learn how to work with Python dates and times: datetime, strftime, strptime, timedelta. |
| logging | Learn about Python logging with RotatingFileHandler and TimedRotatingFileHandler. |
| pdb | Learn how to debug in Python with the interactive source code debugger. |
| unit tests | Learn how to test in Python with Nose unit tests. |

kaggle-and-business-analyses
IPython Notebook(s) used in kaggle competitions and business analyses.
| Notebook | Description |
|---|---|
| titanic | Predict survival on the Titanic. Learn data cleaning, exploratory data analysis, and machine learning. |
| churn-analysis | Predict customer churn. Exercise logistic regression, gradient boosting classifers, support vector machines, random forests, and k-nearest-neighbors. Includes discussions of confusion matrices, ROC plots, feature importances, prediction probabilities, and calibration/descrimination. |

spark
IPython Notebook(s) demonstrating spark and HDFS functionality.
| Notebook | Description |
|---|---|
| spark | In-memory cluster computing framework, up to 100 times faster for certain applications and is well suited for machine learning algorithms. |
| hdfs | Reliably stores very large files across machines in a large cluster. |

mapreduce-python
IPython Notebook(s) demonstrating Hadoop MapReduce with mrjob functionality.
| Notebook | Description |
|---|---|
| mapreduce-python | Runs MapReduce jobs in Python, executing jobs locally or on Hadoop clusters. Demonstrates Hadoop Streaming in Python code with unit test and mrjob config file to analyze Amazon S3 bucket logs on Elastic MapReduce. Disco is another python-based alternative. |

aws
IPython Notebook(s) demonstrating Amazon Web Services (AWS) and AWS tools functionality.
Also check out:
- SAWS: A Supercharged AWS command line interface (CLI).
- Awesome AWS: A curated list of libraries, open source repos, guides, blogs, and other resources.
| Notebook | Description |
|---|---|
| boto | Official AWS SDK for Python. |
| s3cmd | Interacts with S3 through the command line. |
| s3distcp | Combines smaller files and aggregates them together by taking in a pattern and target file. S3DistCp can also be used to transfer large volumes of data from S3 to your Hadoop cluster. |
| s3-parallel-put | Uploads multiple files to S3 in parallel. |
| redshift | Acts as a fast data warehouse built on top of technology from massive parallel processing (MPP). |
| kinesis | Streams data in real time with the ability to process thousands of data streams per second. |
| lambda | Runs code in response to events, automatically managing compute resources. |
commands
IPython Notebook(s) demonstrating various command lines for Linux, Git, etc.
| Notebook | Description |
|---|---|
| linux | Unix-like and mostly POSIX-compliant computer operating system. Disk usage, splitting files, grep, sed, curl, viewing running processes, terminal syntax highlighting, and Vim. |
| anaconda | Distribution of the Python programming language for large-scale data processing, predictive analytics, and scientific computing, that aims to simplify package management and deployment. |
| ipython notebook | Web-based interactive computational environment where you can combine code execution, text, mathematics, plots and rich media into a single document. |
| git | Distributed revision control system with an emphasis on speed, data integrity, and support for distributed, non-linear workflows. |
| ruby | Used to interact with the AWS command line and for Jekyll, a blog framework that can be hosted on GitHub Pages. |
| jekyll | Simple, blog-aware, static site generator for personal, project, or organization sites. Renders Markdown or Textile and Liquid templates, and produces a complete, static website ready to be served by Apache HTTP Server, Nginx or another web server. |
| pelican | Python-based alternative to Jekyll. |
| django | High-level Python Web framework that encourages rapid development and clean, pragmatic design. It can be useful to share reports/analyses and for blogging. Lighter-weight alternatives include Pyramid, Flask, Tornado, and Bottle. |
misc
IPython Notebook(s) demonstrating miscellaneous functionality.
| Notebook | Description |
|---|---|
| regex | Regular expression cheat sheet useful in data wrangling. |
| algorithmia | Algorithmia is a marketplace for algorithms. This notebook showcases 4 different algorithms: Face Detection, Content Summarizer, Latent Dirichlet Allocation and Optical Character Recognition. |
notebook-installation
anaconda
Anaconda is a free distribution of the Python programming language for large-scale data processing, predictive analytics, and scientific computing that aims to simplify package management and deployment.
Follow instructions to install Anaconda or the more lightweight miniconda.
dev-setup
For detailed instructions, scripts, and tools to set up your development environment for data analysis, check out the dev-setup repo.
running-notebooks
To view interactive content or to modify elements within the IPython notebooks, you must first clone or download the repository then run the notebook. More information on IPython Notebooks can be found here.
$ git clone https://github.com/donnemartin/data-science-ipython-notebooks.git
$ cd data-science-ipython-notebooks
$ jupyter notebook
Notebooks tested with Python 2.7.x.
credits
- Python for Data Analysis: Data Wrangling with Pandas, NumPy, and IPython by Wes McKinney
- PyCon 2015 Scikit-learn Tutorial by Jake VanderPlas
- Python Data Science Handbook by Jake VanderPlas
- Parallel Machine Learning with scikit-learn and IPython by Olivier Grisel
- Statistical Interference Using Computational Methods in Python by Allen Downey
- TensorFlow Examples by Aymeric Damien
- TensorFlow Tutorials by Parag K Mital
- TensorFlow Tutorials by Nathan Lintz
- TensorFlow Tutorials by Alexander R Johansen
- TensorFlow Book by Nishant Shukla
- Summer School 2015 by mila-udem
- Keras tutorials by Valerio Maggio
- Kaggle
- Yhat Blog
contributing
Contributions are welcome! For bug reports or requests please submit an issue.
contact-info
Feel free to contact me to discuss any issues, questions, or comments.
- Email: donne.martin@gmail.com
- Twitter: @donne_martin
- GitHub: donnemartin
- LinkedIn: donnemartin
- Website: donnemartin.com
license
This repository contains a variety of content; some developed by Donne Martin, and some from third-parties. The third-party content is distributed under the license provided by those parties.
The content developed by Donne Martin is distributed under the following license:
I am providing code and resources in this repository to you under an open source license. Because this is my personal repository, the license you receive to my code and resources is from me and not my employer (Facebook).
Copyright 2015 Donne Martin

Licensed under the Apache License, Version 2.0 (the "License");
you may not use this file except in compliance with the License.
You may obtain a copy of the License at

   http://www.apache.org/licenses/LICENSE-2.0

Unless required by applicable law or agreed to in writing, software
distributed under the License is distributed on an "AS IS" BASIS,
WITHOUT WARRANTIES OR CONDITIONS OF ANY KIND, either express or implied.
See the License for the specific language governing permissions and
limitations under the License


